
The short version: A forecast is a claim about people, and most forecast populations were never real in commercial data. Only a fraction of a prevalent population is diagnosed, treated and controlled, and the rest produce no data or misleading data. Name which stage of the cascade the forecast is actually claiming, assign an owner to each transition between stages, and build the visibility to see when a transition fails, or the variance will be blamed on uptake, price or channel.
Layer 01 · Clinical & Product
A forecast is not a number. It is a claim about people.
By Patrick R. Coyle
Every peak-year forecast rests on a sentence nobody says out loud: there are this many people with this condition, and we will reach some share of them.
The second half of that sentence gets argued about for months. Share assumptions, competitive entry, formulary scenarios, launch curves. The first half is usually taken from an epidemiology deck and never questioned again.
That is the wrong half to leave alone.
A cascade you can actually check
Hypertension is a useful example precisely because it is unglamorous, enormous and well measured. The CDC publishes the whole cascade.
Among US adults with hypertension, 59.2 percent are aware they have it. 51.2 percent are currently taking medication for it. And 20.7 percent have their blood pressure controlled to below 130/80.
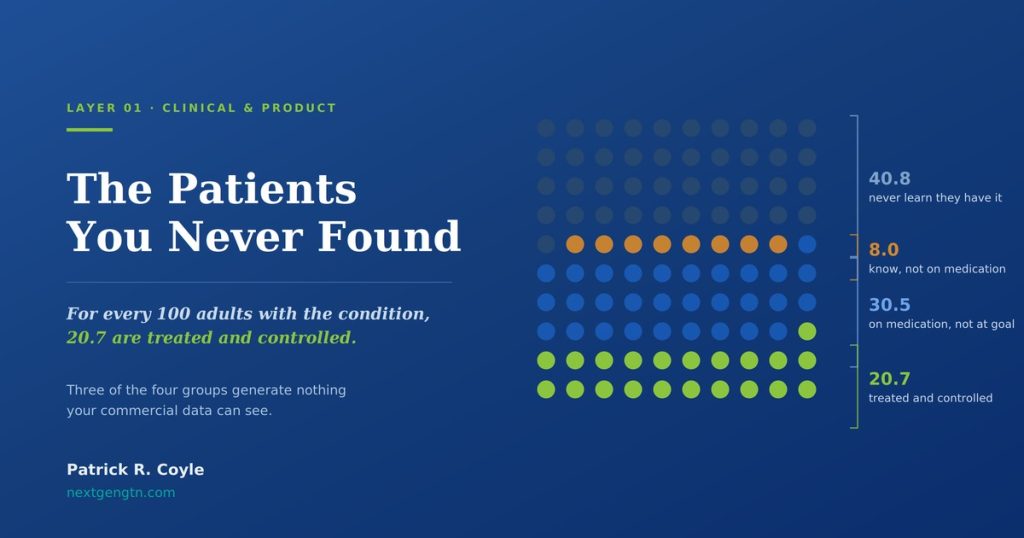
For every 100 adults who have the condition
40.8 never learn they have it
8.0 know, and are not on medication
30.5 are on medication, and are not at goal
20.7 are treated and controlled
Read that column top to bottom. Four groups, and only the last one looks like the patient in the forecast.
Three of the four generate nothing to count
This is the part that matters commercially, and it is structural rather than unfortunate.
A person who is never diagnosed generates no claim, no prescription, no rejection and no reversal. They are not a lost patient in any data set you own. They are not in the denominator, they are not in the numerator, and no report will ever show them to you.
A person who is diagnosed and never started generates a diagnosis code and nothing else. If you are looking at pharmacy data, they do not exist either.
A person who is treated but not at goal generates plenty of data, all of which looks like success. Fills, refills, adherence, persistence. Every commercial metric reads green while the clinical objective is unmet.
Every commercial data set in routine use begins observing at the point a claim adjudicates. Most of the cascade happens before that.
Why the wide range is not an estimation problem
When a population estimate arrives with a wide range, the instinct is to treat the range as measurement uncertainty. Better data, tighter range.
Usually that is backwards. The range does not reflect variance in how many people exist. It reflects variance in how well they are found.
Two institutions treating the same condition in the same city can produce identification rates that differ by a wide margin, not because the biology differs but because one reflex tests at diagnosis and the other sends out with no service level and no tracking. The population is the same. The finding of it is not.
Which means the honest version of the forecast question is not how many patients are there. It is how many will be found, by whom, and how quickly. Those are operational questions with owners, and they can be worked on. Prevalence cannot.
What this does to the rest of the ledger
A brand that never instruments identification has made a decision without discussing it. It has decided that every forecast variance it ever reports will be explained by uptake, price or channel, because those are the only variables it can observe.
The patients it never found will be distributed silently across all three. Access will be blamed for a coverage problem that was actually a diagnosis problem. Trade will be blamed for slow uptake in territories where the specialist wait is nine weeks. Finance will book a variance and attribute it to the market.
Everyone will be reasoning correctly from what they can see. The number will still miss.
Three questions worth asking before the next forecast cycle
Which stage of the cascade is our number counted at?
Prevalence, diagnosed, treated or controlled. These are wildly different numbers for the same condition, and decks routinely move between them without saying so.
Who owns the transition between each stage?
Name a person, not a function. Then name who owns it when the patient crosses between institutions, which most do. That second question is usually met with silence.
What would we see if a transition stopped working?
If the answer is nothing, you are not forecasting that stage. You are assuming it.
None of this requires new data infrastructure to begin. It requires a room where the question is asked out loud, and where somebody writes down the honest answer rather than the aspirational one.
The most expensive patient is not the one who abandons. It is the one who was never found, because nothing in the system will ever tell you they were there.
Source. Hypertension cascade figures from Fryar CD, Kit B, Carroll MD, Afful J. Hypertension prevalence, awareness, treatment, and control among adults age 18 and older: United States, August 2021–August 2023. NCHS Data Brief No. 511. National Center for Health Statistics, October 2024. Awareness 59.2 percent, treatment 51.2 percent and control 20.7 percent are reported among adults with hypertension; the four groups shown above are derived by subtraction. No product, manufacturer or commercial arrangement is described or implied.
About the Author
Patrick R. Coyle built the NextGen GTN™ curriculum and the Patients + Profitability™ philosophy it rests on. He previously served as VP & CFO of Eisai Americas and led Gross-to-Net practice areas at two global advisory firms, with senior finance and commercial roles at Novartis, Insmed, and Bayer.
More frameworks, guides, and tools in the Resource Library. Reach him at hello@patrickrcoyle.com.